FGCU just lost funding. Your university could be next.
Florida Statute 1001.92 redistributes up to $645M annually based on how well graduates do after they leave. FGCU is operating under a Student Success Plan right now. This isn't a future deadline. It's happening now.
Trusted by career services teams at


Featured institution
DeVry University partners with Prentus to track graduate career outcomes at scale.
Across a nationwide campus network, Prentus helps DeVry's career services team verify where graduates land, what they earn, and which programs drive the strongest outcomes, the exact data required under outcomes-based funding models.
What Is Florida Statute 1001.92?
Florida Statute 1001.92, the State University System Performance-Based Incentive, was created in 2015 and has been amended and expanded through 2025. It applies to all 12 State University System (SUS) institutions and ties their annual funding allocations directly to how well they perform on 10 metrics set by the Board of Governors.
Unlike the federal OBBBA standard, which takes full effect in July 2026, Florida's performance model is not a future deadline. It is active. Universities are scored every year. Funds are redistributed every year. And universities that score below 70 points have their performance allocations withheld until they present a Board-approved Student Success Plan.
Florida Gulf Coast University (FGCU) is currently operating under that requirement for 2025-26. Up to $645M in total performance funding cycles through this model annually, with over $350M in state investment tied directly to performance scores.
What Gets Measured
The Metrics That Determine Your Funding
Five of the 10 Board of Governors metrics directly affect how much funding your institution receives. Two of them are about what graduates earn.
Graduate Employment or Continuing Ed
Percentage of Bachelor's graduates employed at $40K+ or enrolled in continuing education one year after graduation. Goal: 85% by 2030. This is the metric most directly tied to what happens after a student leaves your institution.
Median Graduate Wages
Median wages of Bachelor's graduates employed full-time one year after graduation. Goal: $60K by 2030. Low median wages directly lower your performance score and pull down your funding allocation.
4-Year Graduation Rates
Percentage of full-time, first-time-in-college (FTIC) students who graduate within 4 years.
Academic Progress Rate
2nd-year retention of full-time FTIC students with at least 12 credit hours earned in their first year.
University Access Rate
Percentage of undergraduates who receive a Pell Grant, measuring institutional commitment to access for low-income students.
This Is Not Hypothetical
Florida Universities Are Already Paying the Price
FGCU: Student Success Plan Requirement, 2025-26
Florida Gulf Coast University is currently required to operate under a Board of Governors-approved Student Success Plan for 2025-26 after scoring below the 70-point threshold. This means their performance funding is withheld while the Board reviews their remediation plan.
FGCU is not an isolated case. With $645M in performance funds redistributed annually, every SUS institution competes for a share. Universities that improve their employment outcome metrics take funding from those that don't.
Below 70 points = funding withheld
Universities that fall below the threshold don't just score lower. Their performance funds are withheld until they present a Board-approved remediation plan.
$350M+ tied to employment outcomes specifically
Of the total $645M in performance funding, the employment-related metrics (Metric 1 and 2) are among the highest-weighted. Your graduate wage numbers directly affect your dollar allocation.
Top performers take money from the bottom
Performance funds from low-scoring institutions are redistributed to high-performers. Your peers improving their Metric 1 and 2 numbers is a direct threat to your allocation.
Annual scoring means you're always on the clock
The Board of Governors reviews performance data every year. There is no grace period or multi-year runway. Your employment outcome data for this cohort will determine your next allocation.
Get a Free Outcomes Diagnosis
Bring your Metric 1 and Metric 2 numbers. Leave with a maturity assessment against Florida 1001.92 and a gap plan for protecting your allocation. 30 minutes, no sales pitch.
Get a Free Outcomes DiagnosisThe Prentus Approach
Automated Outcome Tracking for Florida SUS Compliance
Career services teams at 1:500 advisor-to-student ratios can't run continuous employment surveys at scale. Prentus automates the tracking so your Metric 1 and 2 data is always current.
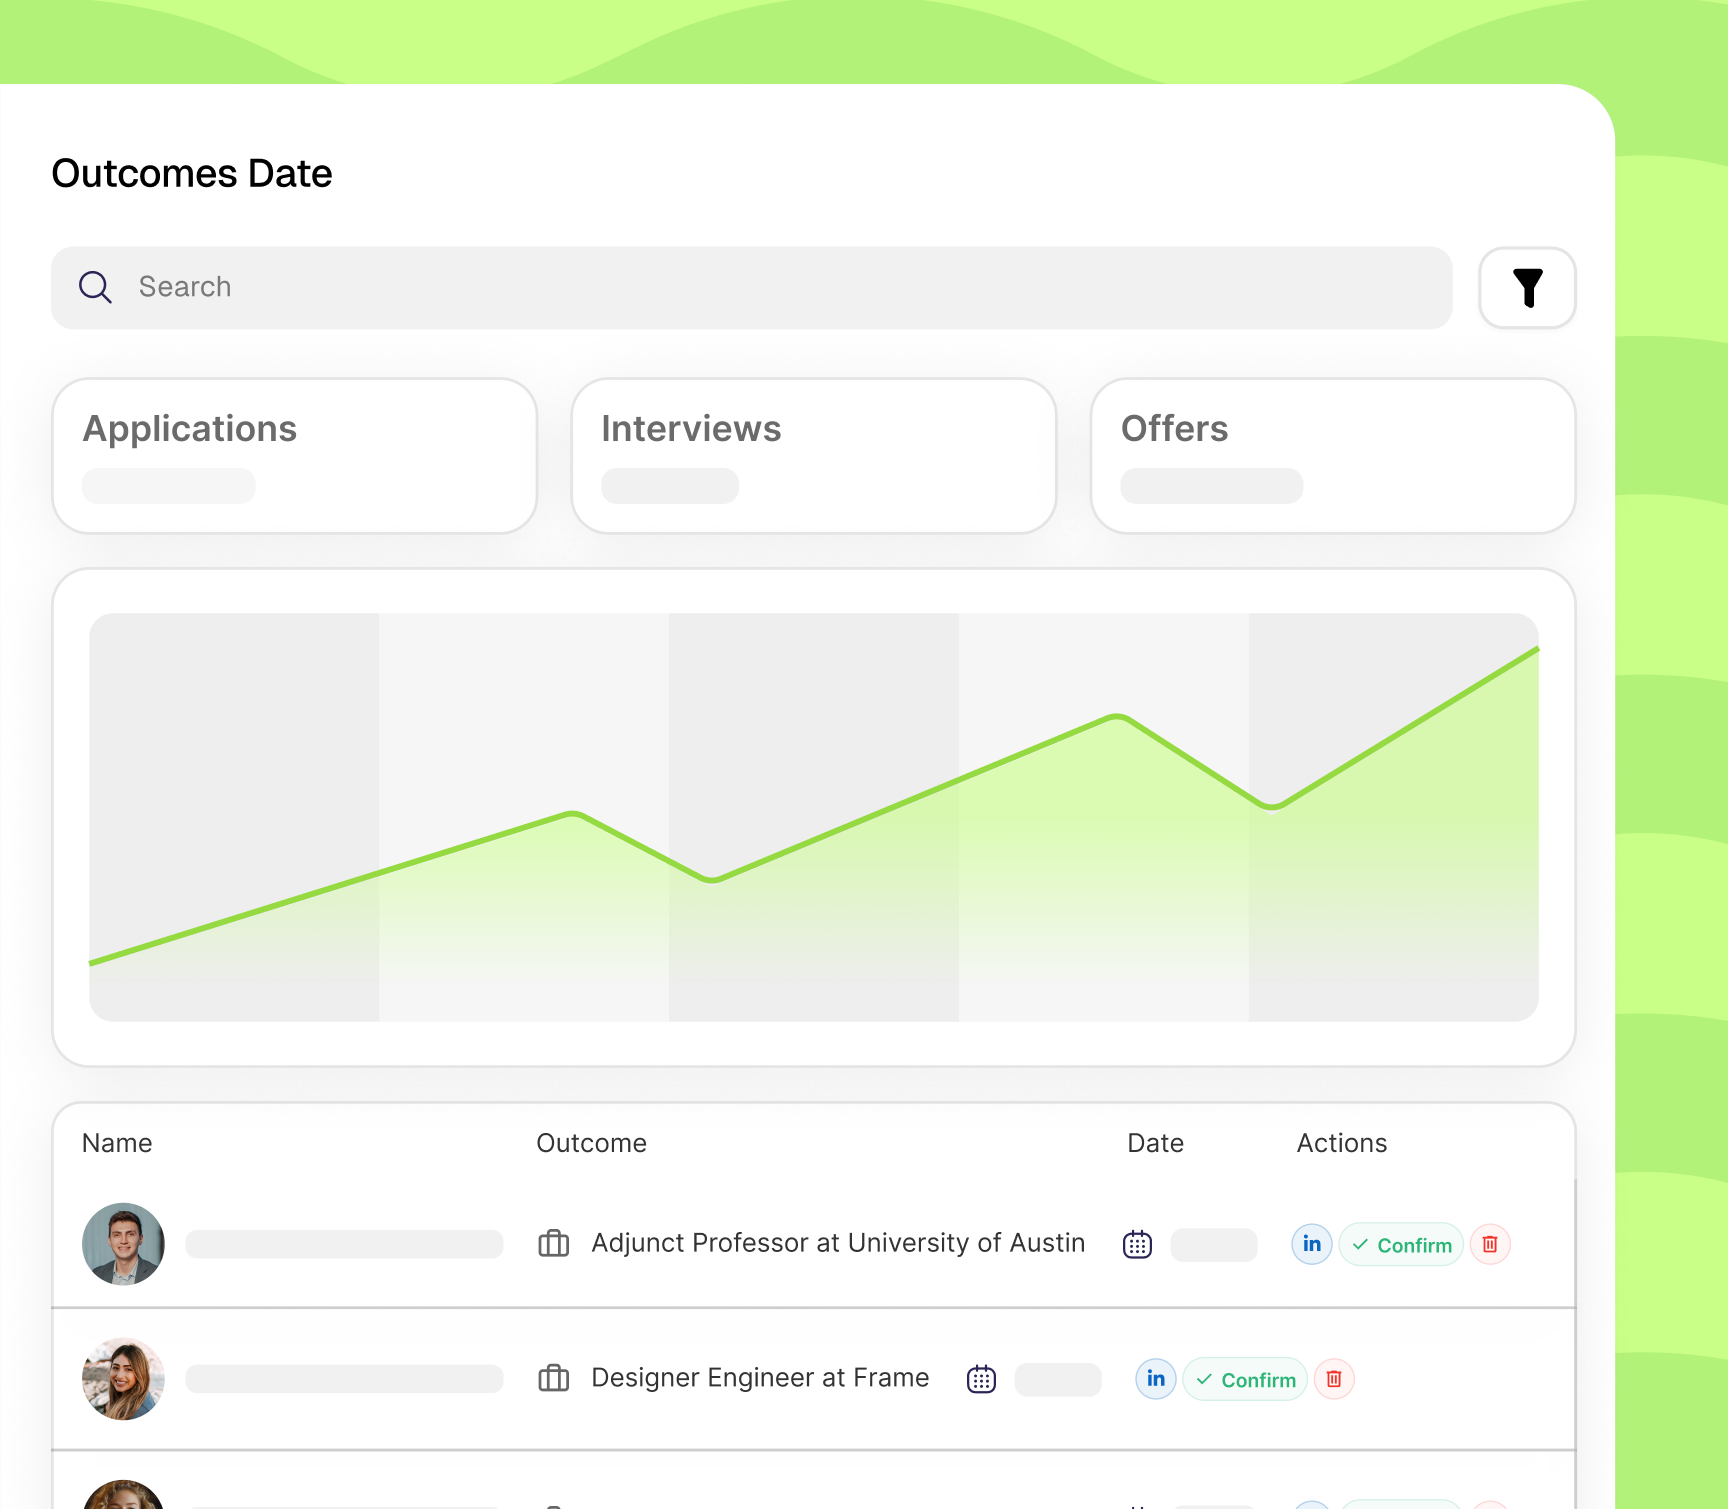
LinkedIn Auto-Detection
Prentus automatically scans LinkedIn to verify employment status, employer, and role for each graduate. Your Metric 1 employment rate updates continuously without survey campaigns.
Graduate Wage Data by Program
Export graduate earnings segmented by program, graduation year, and employment status. The exact format the Board of Governors uses to calculate Metric 2.
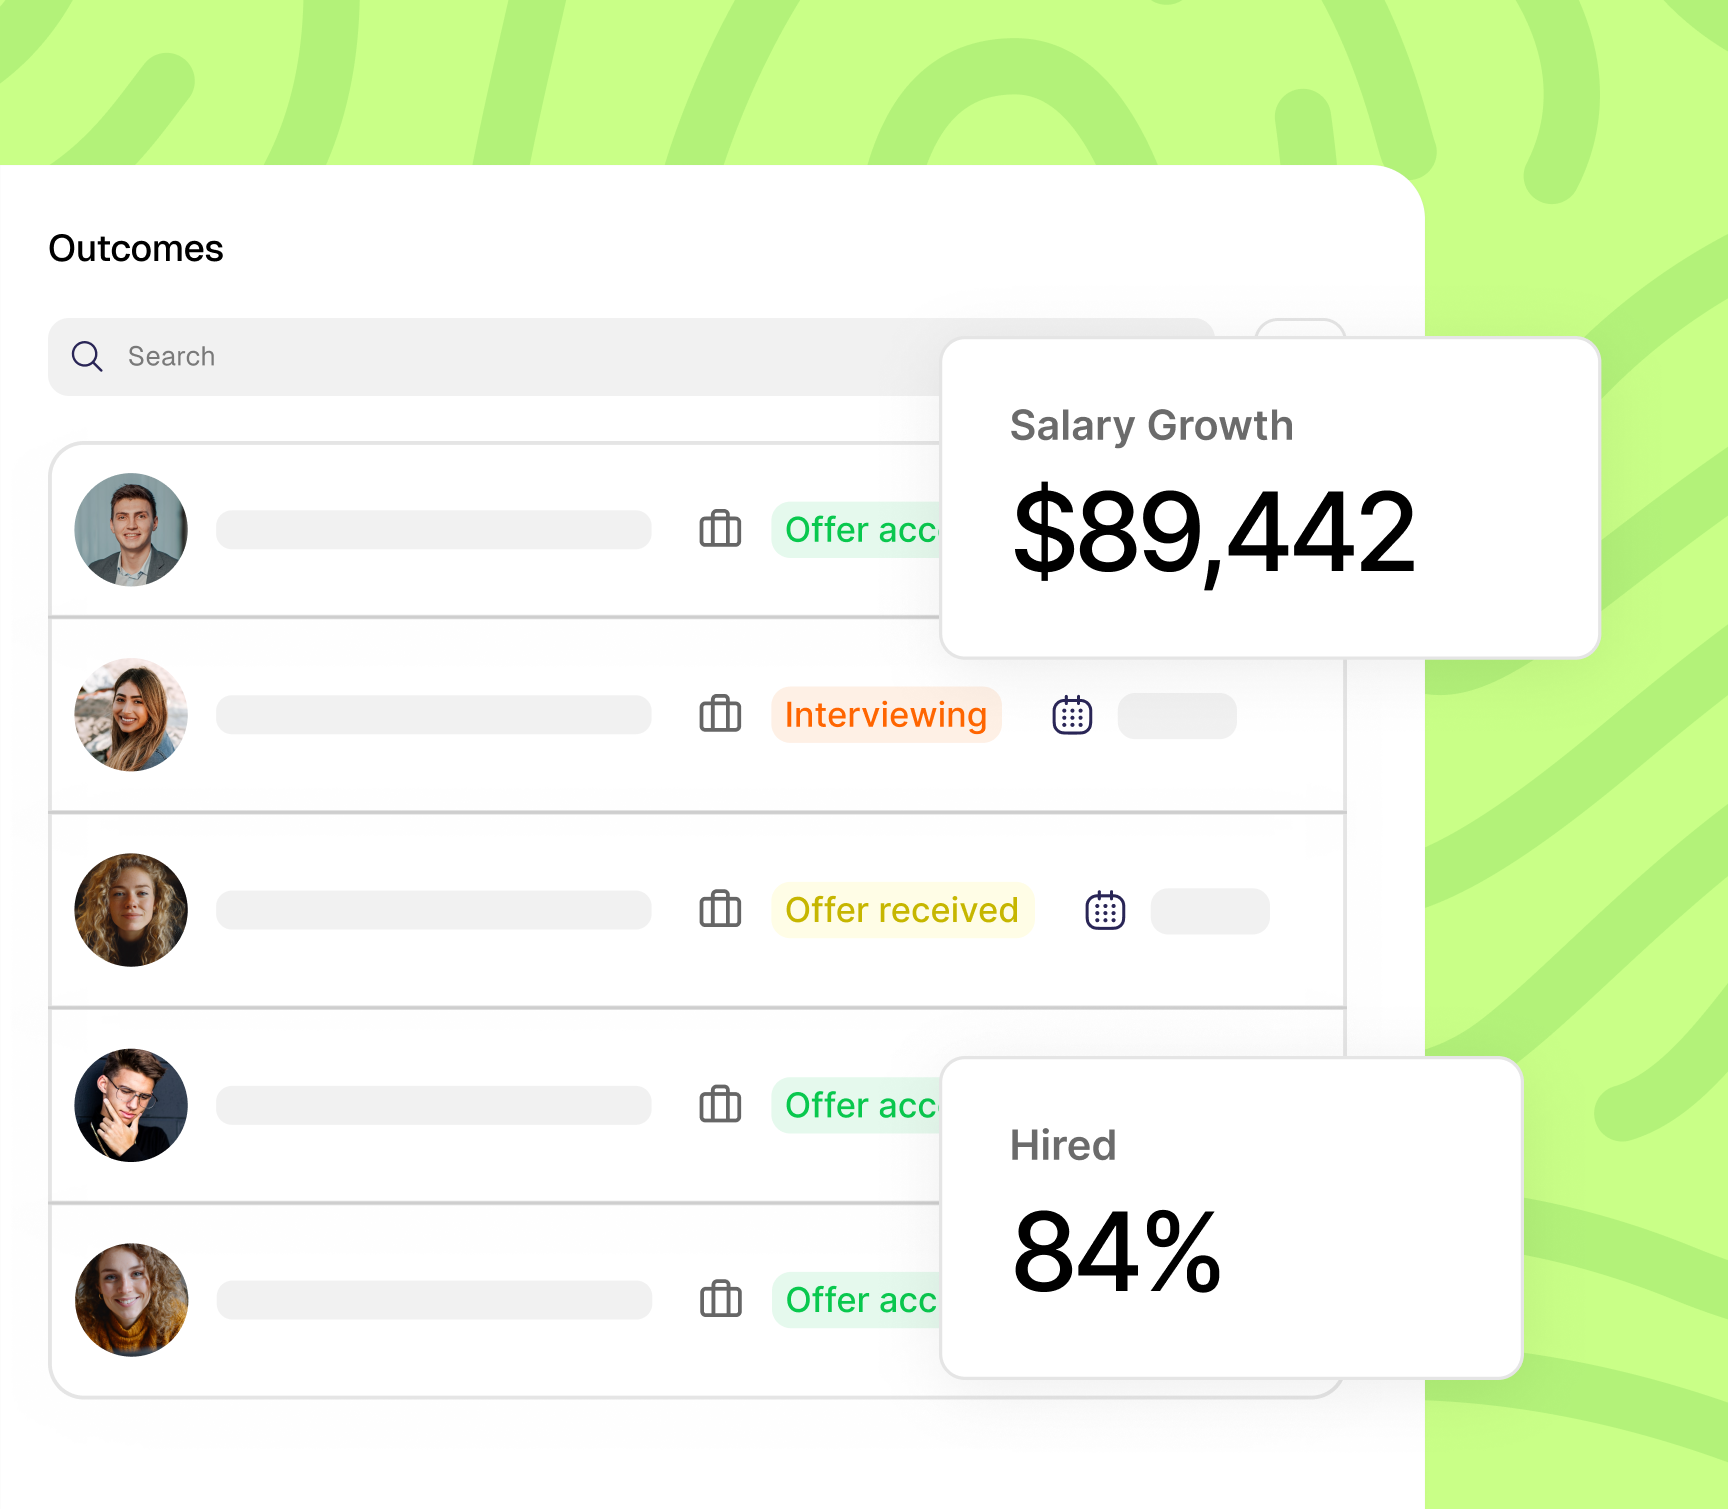
Performance Score Dashboard
See your current Metric 1 and 2 rates against the 85% employment and $60K wage goals at a glance. Know where you stand before the Board of Governors does.
One-Year Post-Graduation Tracking
The Board of Governors measures employment at the one-year mark. Prentus tracks graduate employment continuously so the 12-month snapshot is already accurate when you need it.
Track every SUS metric in one dashboard: Metric 1 employment, Metric 2 wages, and everything tied to your annual performance score.
The Old Way vs the Prentus Way
✗ Without Prentus
- ✗Annual alumni surveys with 20-30% response rates: not enough for accurate Metric 1 data
- ✗Staff manually pulling employment numbers from alumni office, LinkedIn searches, and phone calls
- ✗No visibility into Metric 2 wage trends until the Board of Governors publishes scores
- ✗Outcome reports take months to prepare for Board presentations
- ✗Risk of falling below 70 points before the institution knows it has a problem
- ✗Remediation plans written reactively instead of proactive performance management
 With Prentus
- ✓LinkedIn auto-detection tracks employment continuously: Metric 1 data always current
- ✓Graduate wage data organized by program and cohort automatically
- ✓Real-time dashboard shows current Metric 1 and 2 rates vs 85% and $60K goals
- ✓Board-ready outcome reports in minutes, not months
- ✓Early warning when employment rates trend toward threshold risk
- ✓Data to inform proactive career services investment before the Board reviews
Free Resource
Florida 1001.92 Outcomes Readiness Checklist
10 data capabilities Florida SUS institutions need to protect their performance-based funding allocation.
Graduate Employment Rate Tracking
You track the percentage of Bachelor's graduates employed at $40K+ or in continuing education one year after graduation, the exact definition of Metric 1.
Median Wage Data by Program
You capture median full-time wages at the program and institution level, not just institution-wide averages. Metric 2 is assessed at graduation cohort level.
One-Year Post-Completion Measurement
Your tracking system captures employment data at the one-year mark after graduation, the specific window the Board of Governors uses for Metric 1 and Metric 2 scoring.
Threshold Proximity Monitoring
You can see, at any time, how close your institution is to the 85% employment goal (Metric 1) and $60K wage goal (Metric 2), not just at annual review time.
Verified Employment Data
You don't rely solely on self-reported alumni surveys. LinkedIn verification and employer records back up your employment rate numbers with independently verifiable data.
Cohort Continuity
You track the same graduating cohort over time, not snapshot surveys of whoever responds. This is how the Board of Governors calculates your performance score.
Non-Responder Documentation
You have a documented process for graduates who don't respond to employment follow-ups, with final status records and attempt logs that hold up to audit.
Student Success Plan Early Warning
You have visibility into your performance trajectory before the Board of Governors review, not after your score falls below 70 and you're already in remediation.
2nd Year Retention Tracking
Metric 5 (academic progress rate) measures 2nd-year retention of full-time FTIC students. Your data systems capture this without manual extraction from SIS.
Board-Ready Outcome Reports
You can produce employment outcome reports by program, graduation cohort, and metric within days of a board request, not a weeks-long data pull across three systems.
Free Download
Get the Florida 1001.92 Performance Funding Readiness Checklist PDF
A 10-point guide to the data your SUS institution must track to defend its share of the $645M performance funding pool. Built for provosts, institutional research, and career services leaders.
Common Questions
Florida Performance Funding FAQ
Does Florida 1001.92 apply to all SUS institutions?
Yes. All 12 State University System institutions are subject to the performance-based incentive model under F.S. 1001.92. This includes University of Florida, Florida State University, Florida International University, University of South Florida, Florida Atlantic University, Florida Gulf Coast University, University of West Florida, University of North Florida, Florida A&M University, New College of Florida, Florida Polytechnic University, and University of Central Florida.
What does a Student Success Plan actually require?
Universities that score below 70 points must submit a Student Success Plan to the Board of Governors that outlines specific, measurable actions the institution will take to improve performance. The plan must be approved by the Board before withheld performance funds are released. FGCU's current plan is a public example of what remediation looks like under this framework.
Can institutions appeal their performance scores?
Yes. Institutions can present data and context to the Board of Governors, particularly if they believe scores don't accurately reflect their actual graduate outcomes. However, the appeal process depends on having verified, auditable employment outcome data available. Institutions without continuous tracking are at a significant disadvantage in any appeal situation.
Get a Free Outcomes Diagnosis
Bring your Metric 1 and Metric 2 numbers to a 30-minute working session. Leave with a maturity assessment against Florida 1001.92 and a gap plan. No sales pitch.
Book 30-Minute DemoOr read the full Florida performance funding explainer, or see how Texas HB 8 compares. For compliance updates in your inbox weekly, subscribe to the Weekly Workforce Wire.