Florida universities are not waiting for federal legislation to change how they're held accountable for graduate outcomes. That accountability is already here, and it's already costing institutions money.
Florida Statute 1001.92, the State University System Performance-Based Incentive, has been in effect since 2015. It ties the annual funding allocation for all 12 SUS institutions directly to performance scores. The Board of Governors reviews scores every year. Funds are redistributed every year. And Florida Gulf Coast University is currently operating under a Student Success Plan — meaning its performance allocation is withheld — for 2025-26.
For higher ed administrators focused on the federal OBBBA deadline in July 2026, Florida's performance model is a useful reminder: the pressure on employment outcome data isn't coming. For Florida SUS institutions, it arrived years ago.
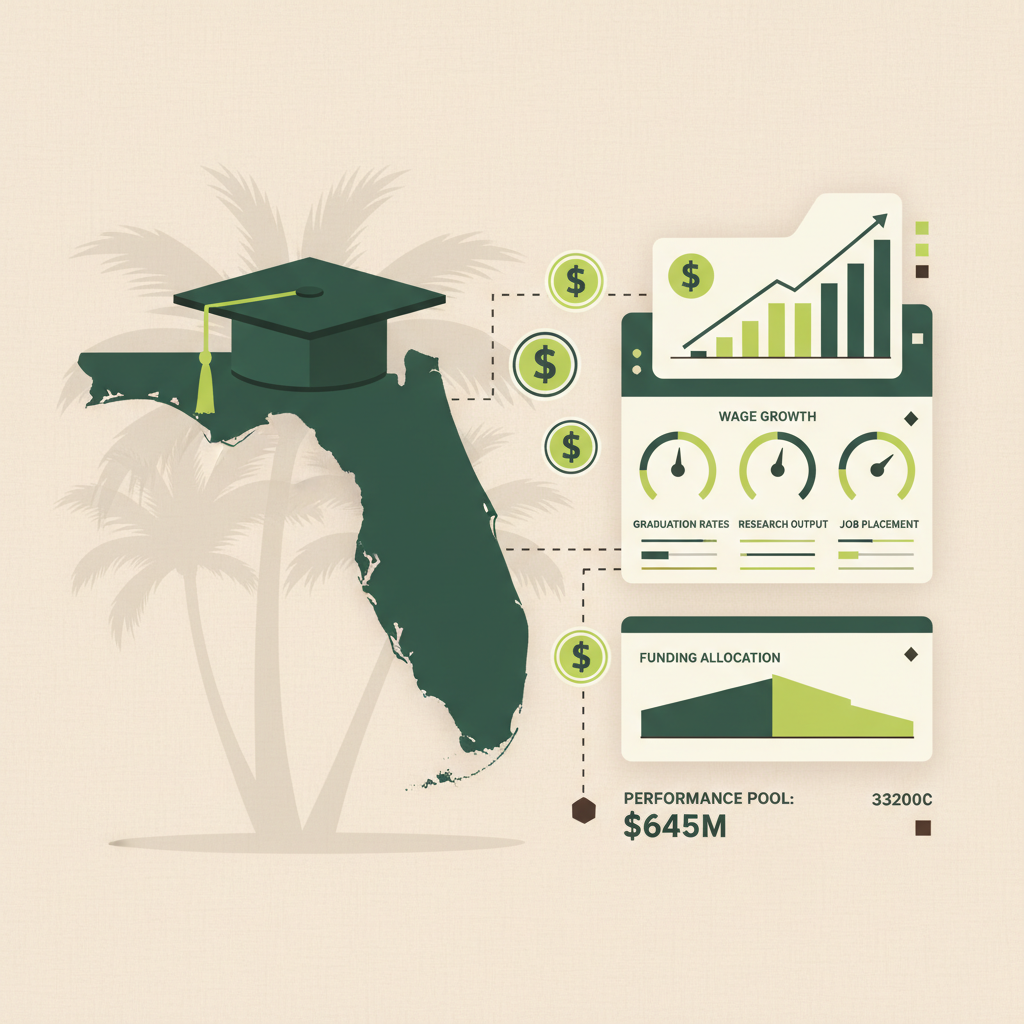
Florida performance-based funding is the state model under Florida Statute 1001.92, in effect since 2015 and amended through 2025, that scores all 12 State University System institutions annually on 10 metrics and redistributes up to $645 million based on those scores. Graduate employment rate and median wages, Metrics 1 and 2, are the two measures most directly tied to career outcomes and drive a significant share of each university's allocation. Universities that fall below 70 points have their performance funds withheld pending a Board-approved Student Success Plan, a status Florida Gulf Coast University currently holds for 2025-26. Unlike the pending federal OBBBA requirements, this accountability model has already been redistributing real dollars for a decade. Prentus gives career services teams the verified employment and wage data needed to track these metrics throughout the year instead of reacting after scores are published.
Quick Summary
Florida Statute 1001.92 scores all 12 SUS universities annually on 10 metrics set by the Board of Governors. Up to $645M in performance funding is allocated based on those scores. The two metrics most directly tied to career outcomes — graduate employment rates (Metric 1) and median wages (Metric 2) — determine a significant share of each university's annual allocation. Universities that fall below 70 points have their performance funds withheld pending a Board-approved Student Success Plan. FGCU is currently under that requirement.
Key Takeaways
- F.S. 1001.92 is already active. Created in 2015, amended through 2025. No future deadline.
- $645M redistributed annually. Performance scores determine each institution's share of the funding pool.
- Metric 1 and 2 are employment metrics. Graduate employment rate and median wages are the primary drivers of the performance score.
- Below 70 = funding withheld. FGCU is currently under a Student Success Plan requirement for 2025-26.
- Top performers take from the bottom. Withheld funds from low-scoring institutions are redistributed to high-scoring ones.
How Florida's performance model works
The Board of Governors scores each SUS institution annually on 10 metrics. Each metric contributes to a total score. Universities are ranked by score. Performance funds are allocated accordingly. Universities that perform well receive more. Universities that perform poorly receive less — or nothing, if they fall below the 70-point threshold.
The model is explicitly competitive. There is a fixed pool of performance funding. Better scores for one institution mean more funding for that institution and less for others. This is not a pass/fail compliance exercise. It is an ongoing competition between 12 institutions for the same pool of money.
The 10 metrics include graduation rates, retention, research spending, and access measures. But two of them are directly about what happens to graduates after they leave: Metric 1 (employment or continuing education rate) and Metric 2 (median graduate wages). Together these represent the most actionable data point for career services and academic leadership — the part of the score your institution has the most direct ability to influence.
Metric 1: The employment rate goal that most SUS institutions haven't hit yet
Metric 1 measures the percentage of Bachelor's graduates who are either employed at $40,000 or more, or enrolled in continuing education, one year after graduation. The Board of Governors has set a goal of 85% by 2030.
The 85% goal matters because the scoring isn't just about whether you hit the target. It's about where you land relative to it and relative to peer institutions. Universities closer to 85% score better on Metric 1. Universities farther away score lower. And every year, the best-performing institutions take a larger share of the performance pool.
What's difficult about Metric 1 is the data collection window. You need verified employment status one year after graduation for the graduating cohort. Not six months, not a survey at commencement, not an alumni response to a LinkedIn message. One year post-graduation, verified employment at $40K+. For most career services teams, this data simply doesn't exist in a form they can report confidently. Building continuous outcome tracking infrastructure is the only way to close that gap before the Board of Governors scores you.
Metric 2: The wage goal that exposes programs, not just institutions
Metric 2 measures median wages of Bachelor's graduates employed full-time one year after graduation. The Board of Governors has set a goal of $60,000 median by 2030.
Unlike Metric 1, which is a headcount rate, Metric 2 is a dollar number. It's affected by which programs your graduates come from and what those fields pay. A university with a large share of graduates in high-wage fields will naturally have a higher median. A university with many graduates in lower-wage fields will struggle to move this number without either changing its program mix or improving placement rates in higher-wage roles within each field.
This is where program-level wage data matters. An institution-level median of $52K doesn't tell you which programs are pulling the number down. A program-level breakdown shows where the gaps are — and where targeted career services intervention can actually move the metric.
FGCU: what a Student Success Plan actually looks like
Florida Gulf Coast University is the most visible current example of what happens when a Florida SUS institution falls below 70 points. For 2025-26, FGCU is required to operate under a Board of Governors-approved Student Success Plan.
A Student Success Plan is not just paperwork. It means the institution's performance funding allocation is withheld pending Board review and approval of the remediation strategy. The university has to present specific, measurable actions it will take to improve its performance scores. Until the Board approves the plan, the money doesn't flow.
FGCU is not unusual in having performance challenges. What's instructive about its situation is the mechanism: the accountability is real, the consequences are financial, and the data that drives the score is graduate employment outcomes — exactly the data that most career services offices aren't capturing continuously. When graduates cannot earn enough to service their debt, the student loan default crisis compounds the problem for the institution and the student.
The other thing worth noting: funds withheld from FGCU don't disappear. They get redistributed to top-performing institutions. So a weaker score doesn't just mean less for you. It actively means more for your competition.
For VP-Level Administrators at Florida SUS Institutions
Your Metric 1 and 2 numbers are being calculated right now. Do you know what they are?
Prentus automatically tracks graduate employment and wages at the program level. That means your performance score data is always current and you can see your Metric 1 and Metric 2 trajectory before the Board of Governors sees it — not after your funding is withheld.
See the full compliance planThe data Florida universities need to protect their allocation
The gap between what most SUS institutions can currently report and what actually protects their performance allocation is primarily a data collection problem, not a strategy problem. The strategy is clear: improve graduate employment rates and wages. The challenge is knowing what those numbers are in real time, at the program level, so you can actually act on them.
Here's what that data infrastructure needs to capture:
- Graduate employment status one year post-graduation: Not at six months, not at commencement. Specifically the 12-month snapshot the Board of Governors uses to calculate Metric 1.
- Wage data at the individual and program level: The institution-level median is what gets reported for Metric 2, but program-level data is what tells you where the problem is and how to fix it.
- Continuing education enrollment verification: Metric 1 counts graduates who are in continuing education at the one-year mark. That enrollment status needs to be verified, not assumed.
- Non-responder documentation: When graduates don't respond to employment follow-ups, you need a documented process with attempt records and final status codes. This protects you in any Board-level review of your data methodology.
- Performance threshold monitoring: Not just at annual review time. Your current Metric 1 and 2 trajectory, updated continuously, so you can make resource allocation decisions before the Board scores you.
Why most career services teams can't do this manually
Florida SUS universities range from 4,000 to 70,000 students. At a 1:500 advisor-to-student ratio, a career services team is not going to run continuous employment verification for every graduate while also doing intake advising, employer partnerships, job placement support, and day-to-day student interactions.
The annual alumni survey — the default approach for most institutions — produces a snapshot of whoever responds. Response rates on alumni surveys are typically 20-35%. That means 65-80% of your graduates are unaccounted for in the data that determines your Metric 1 score. You're reporting on a subset and hoping it reflects the whole.
The institutions that are taking this seriously are automating. LinkedIn-based employment verification runs continuously in the background. Graduate employment status updates without anyone chasing alumni for survey responses. Program-level wage data is always current. When the Board of Governors reviews your scores, you're not scrambling to compile data. You already know your numbers.
How Prentus surfaces the data the Board of Governors needs
Prentus automatically tracks where graduates go after graduation using LinkedIn verification and employer data. Employment status and employer details update continuously for every graduate — not on a survey schedule.
For Florida SUS institutions, this means:
- Your Metric 1 data is always current. The one-year employment snapshot is already accurate when the Board review period arrives. You don't scramble to collect it.
- Your Metric 2 numbers are broken down by program. You see which programs are pulling down the institution-level median — and where targeted investment in career services can move the number.
- You know your performance trajectory before the Board does. Dashboard views of current Metric 1 and 2 rates against the 85% and $60K goals give you lead time to act, not react.
- Board-ready reports are available in minutes. When a VP or provost asks for the employment outcome numbers before a Board meeting, you have them.
Frequently asked questions about Florida 1001.92
Does Florida's performance model apply to community colleges?
No. Florida Statute 1001.92 applies specifically to the 12 State University System institutions. Florida community colleges operate under a separate performance accountability framework. If you're at a Florida College System institution, a different set of metrics and accountability structures applies.
How is the $645M performance funding pool divided?
Performance funding is allocated based on relative scores, not absolute thresholds. Higher-scoring institutions receive larger allocations from the pool. The redistribution mechanism means that as some institutions improve their scores, they take share from institutions that don't. The exact allocation formula is updated by the Board of Governors and is published in the annual Accountability Report.
How does Florida's performance model relate to the federal OBBBA standard?
They are separate frameworks. Florida's 1001.92 is state-level and already active. The federal OBBBA Do No Harm standard takes effect July 1, 2026 and applies to all Title IV degree programs nationally. Florida SUS universities will ultimately be accountable under both systems simultaneously. The data infrastructure needed to meet Metric 1 and 2 under 1001.92 also positions institutions well for OBBBA compliance.
Can a university appeal its performance score?
Yes, but the appeal depends on having verified, auditable outcome data available to present to the Board. Institutions that rely on survey-based data with 25% response rates are in a weak position to appeal. Institutions with continuous, verified employment tracking have a stronger evidentiary foundation for any score challenge.
For a detailed breakdown of the tracking requirements and a readiness checklist, see the Florida performance funding compliance hub.